August 14, 2025
3 min read
Key takeaways:
- This analysis examined three phenotypes of pulmonary hypertension (PH) associated with COPD.
- Patients with end-stage COPD with or without PH had the highest median total emphysema index.
Patients with end-stage COPD with or without pulmonary hypertension had significantly different clinical, hemodynamic and imaging characteristics from patients with mild COPD with a pulmonary vascular phenotype, according to study results.
The analysis that revealed this finding was published in ERJ Open Research.

Data were derived from Steger M, et al. ERJ Open Res. 2025;doi:10.1183/23120541.00716-2024.
“Our results support the complexity of PH-COPD, with phenotypes ranging from PH associated with end-stage disease (phenotype 1), characterized by predominant parenchymal remodeling with severe emphysema, to [pulmonary vascular phenotype] (phenotype 3), mainly due to pulmonary vascular remodeling,” Mathilde Steger, MD, of the chest diseases department at the University Hospital of Strasbourg in France, and colleagues wrote. “Phenotype 2 appears to be an intermediate state combining the two compartments.”
In a retrospective analysis, Steger and colleagues evaluated 153 patients with COPD who underwent right heart catheterization to uncover how clinical, hemodynamic and imaging characteristics differ between three phenotypes of PH associated with COPD: end-stage COPD with or without PH (n = 81; group 1), moderately severe COPD with mild to moderate pre-capillary PH (n = 37; group 2) and mild COPD with a pulmonary vascular phenotype (severe PH-COPD; n = 35; group 3).
Within group 1, most of the patients either had mild to moderate PH-COPD (60.5%) or no PH (37%), leaving only 2.5% with severe untreated PH-COPD, according to the study.
In terms of demographics, researchers found that all 153 patients had a smoking history, but there were significant differences in median age (group 1, 60 years; group 2, 66 years; group 3, 71 years), sex (group 1, 48% men; group 2, 62% men; group 3, 88.6% men) and median BMI (group 1, 21.9 kg/m2; group 2, 25.4 kg/m2; group 3, 27.6 kg/m2).
Clinical characteristics
The study highlighted that patients with severe PH-COPD had the highest median FEV1 of the three groups (67% predicted vs. group 2, 50% predicted and group 1, 19% predicted), as well as the greatest proportion of patients with hypertension (83% vs. 46% and 35.8%), diabetes (51% vs. 16.2% and 9.9%) and coronary artery disease (68% vs. 21.6% and 23.4%).
These patients also had the lowest median PaO2 (50 mmHg) and median PaCO2 (34 mmHg) whereas patients with end-stage COPD with or without PH had the highest PaO2 (62 mmHg) and PaCO2 (46 mmHg).
“In this [group 3] phenotype, patients were more hypoxemic and hypocapnic,” Steger and colleagues wrote.
“Group 1 patients were normo-/hypercapnic,” the researchers added.
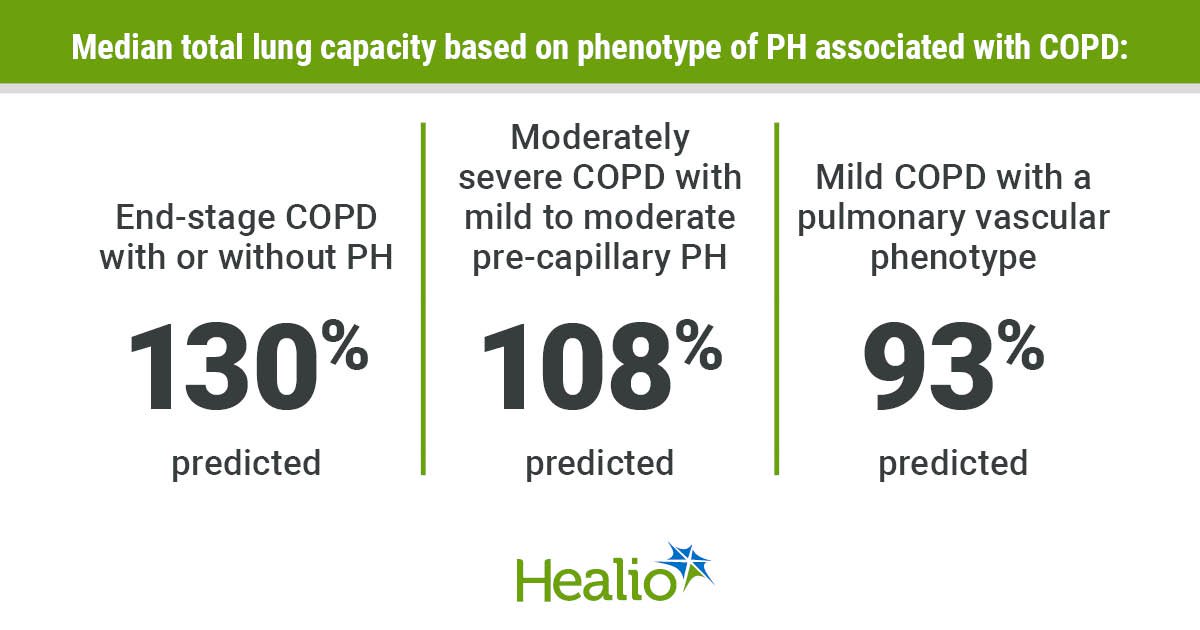
In addition to having the highest PaO2 and PaCO2, researchers observed the highest total lung capacity among those with end-stage COPD with or without PH (130% predicted vs. group 2, 108% predicted and group 3, 93% predicted), as well as the highest residual volume (261% predicted vs. group 2, 148% predicted and group 3, 98% predicted).
“Group 1 had significantly marked lung hyperinflation with increased total lung capacity and residual volume, a feature not observed in group 3,” Steger and colleagues wrote.
Using New York Heart Association functional classes (FCs), in which FC III or IV signal dyspnea, the study reported a higher proportion of patients with end-stage COPD with or without PH and patients with severe PH-COPD in these FCs vs. patients with mild to moderate pre-capillary PH-COPD (92.6% and 100% vs. 59.5%).
Notably, the phenotype group with the highest median 6-minute walk distance was those with mild to moderate pre-capillary PH-COPD (310 m), followed by those with severe PH-COPD (241 m) and those with end-stage COPD with or without PH (219 m), according to the study.
Hemodynamic, imaging characteristics
Similar to the clinical characteristics, various hemodynamic characteristics significantly differed between the phenotype groups. Researchers found the lowest mean pulmonary artery pressure among those with end-stage COPD with or without PH (median, 23 mmHg vs. group 2, 27 mmHg and group 3, 46 mmHg). Of the three groups, these patients also had the lowest pulmonary vascular resistance (median, 2.8 WU vs. 3.7 WU and 8.9 WU).
Patients with end-stage COPD with or without PH continued to stand out from the other groups by having the highest median cardiac index at 3.1 L/minute–1/m–2 vs. 2.9 L/minute–1/m–2 in group 2 and 2.1 L/minute–1/m–2 in group 3, according to the study.
Using chest CT scans, researchers observed the highest degree of emphysema severity among patients with end-stage COPD with or without PH, whereas those with severe PH-COPD only had mild emphysema. Those with mild to moderate pre-capillary PH-COPD fell in the middle of the two groups with moderate emphysema.
Following a similar pattern, the study reported that patients with end-stage COPD with or without PH had the highest median total emphysema index (55%), followed by patients with mild to moderate pre-capillary PH-COPD (32%) and patients with severe PH-COPD (16%; P < .0001).
“In the current debate on how to distinguish PH-COPD phenotypes, it might be worthwhile to include quantitative emphysema thresholds in future diagnostic and management algorithms,” Steger and colleagues wrote. “Further studies are needed to validate these findings and assess their implications for management strategies.”


